Geometry
How far is the action mismatch?
Measure exact one-dimensional Wasserstein-1 distance on sorted, decoded physical values. Larger probability displacements incur larger transport costs.
Physical action distancefor Distilling Vision-Language-Action Models
with Discrete Autoregressive Decoding
01 / The idea
Moving probability to a nearby control value and moving it to a distant one produce different physical errors. Conventional probability matching does not explicitly encode this distance. PGOT brings action geometry into distillation.
We introduce Physically Grounded Optimal Transport (PGOT) for distilling vision-language-action policies with discrete autoregressive action decoding.
Geometry aligns teacher and student action distributions using decoded physical distances. Criticality emphasizes transitions in expert actions. Reliability conditions teacher transfer on agreement with demonstrations.
With Qwen2.5-VL-7B and Qwen3.5-9B teachers, domain-specific Qwen3.5-0.8B students improve average success and repeated completion on UAV navigation and robotic manipulation.
Illustrative 9-bin distributions on [0, 1], each with 0.60 peak probability and 0.05 in every other bin. PGOT uses 256 action tokens.
02 / The method
PGOT uses teacher output distributions and offline expert demonstrations. All three components act during training; deployment retains the student’s architecture and autoregressive action decoder.
How far is the action mismatch?
Measure exact one-dimensional Wasserstein-1 distance on sorted, decoded physical values. Larger probability displacements incur larger transport costs.
Physical action distanceWhere does control change?
Increase distillation weight around large changes in neighboring expert actions, concentrating learning on navigation maneuvers and gripper transitions.
Action-transition weightingWhich teacher guidance should transfer?
Attenuate teacher bins far from the demonstrated action and gate transport by teacher–expert agreement in the decoded physical action space.
Expert-conditioned transfer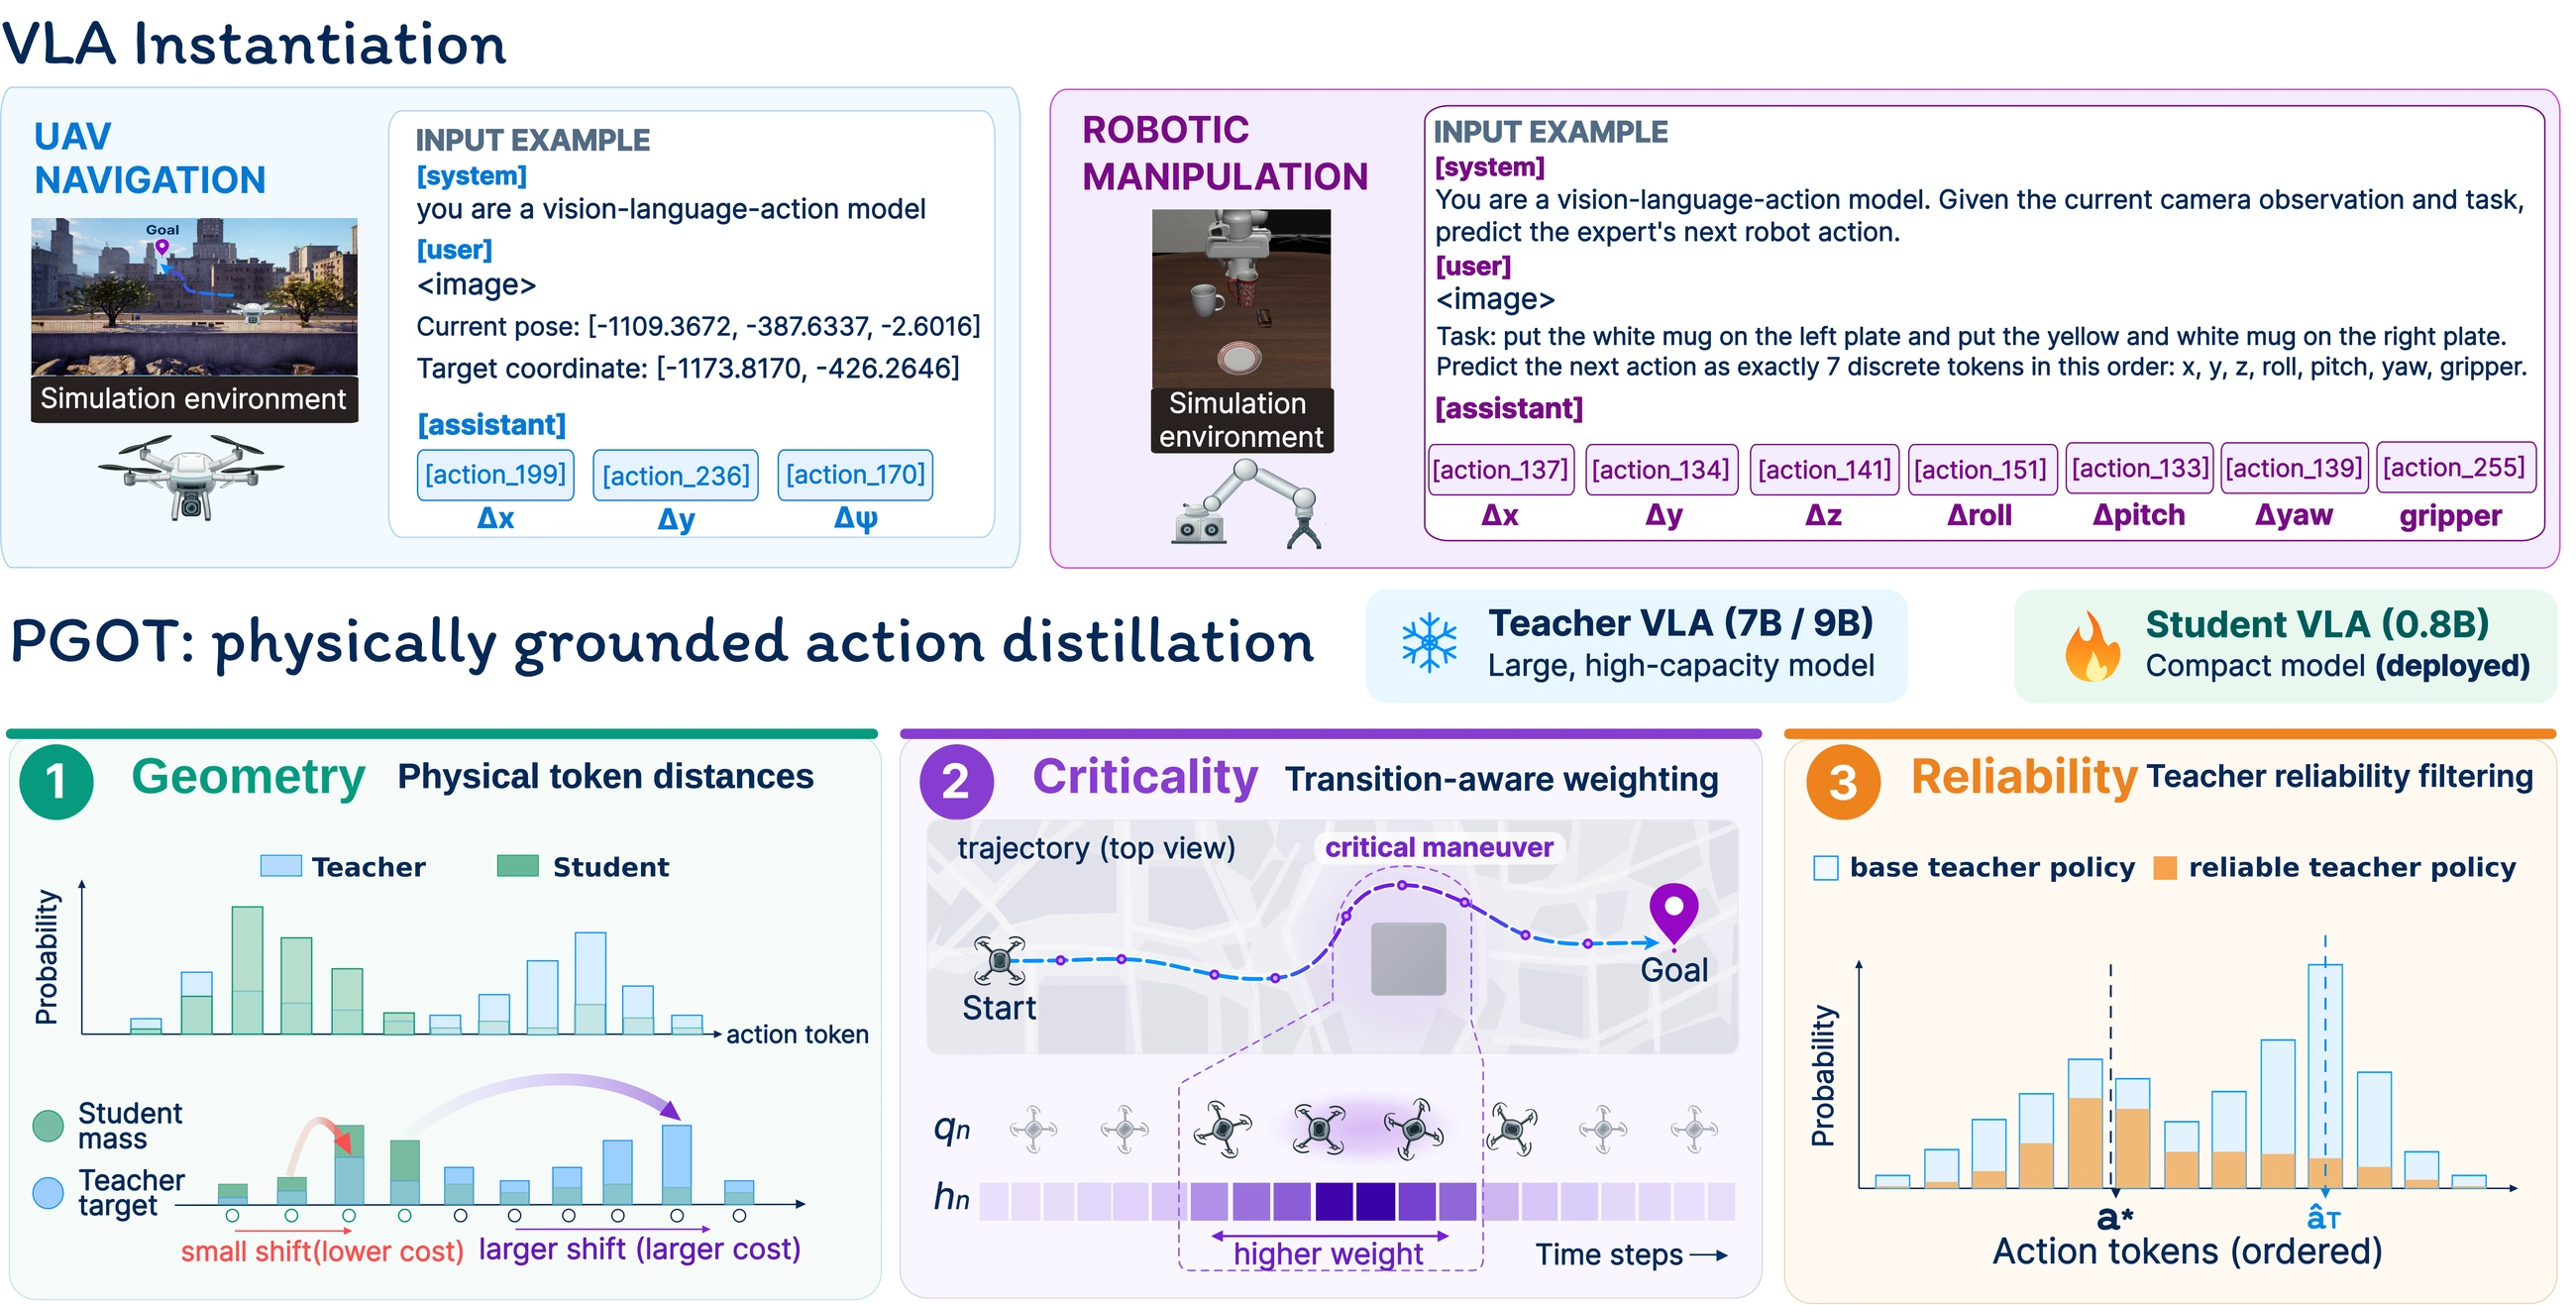
03 / The evidence
PGOT achieves the highest success rate and three-out-of-three completion among the evaluated policies in both domains, using the same distillation coefficients.
150 start–goal configurations · 3 executions each · 0–500 m · 200-step horizon
| Policy | SR (%) ↑ | Pass³ (%) ↑ | CR (%) ↓ | TR (%) ↓ | MMBC (m) ↑ |
|---|---|---|---|---|---|
| Teacher SFT 7B | 87.56 ± 1.39 | 78.67 | 9.78 | 2.67 | 5.00 |
| Student SFT | 53.33 ± 1.15 | 38.67 | 44.00 | 2.67 | 2.78 |
| FKL | 85.33 ± 1.33 | 74.67 | 11.78 | 2.89 | 5.27 |
| RKL | 78.00 ± 2.31 | 68.00 | 16.00 | 6.00 | 5.00 |
| ABKD | 80.89 ± 1.02 | 67.33 | 15.56 | 3.56 | 4.98 |
| ToDi | 75.56 ± 3.42 | 62.00 | 17.78 | 6.67 | 5.00 |
| Shallow-π | 85.33 ± 0.67 | 74.00 | 10.89 | 3.78 | 5.09 |
| VLA-AD | 74.89 ± 0.38 | 58.00 | 20.89 | 4.22 | 4.20 |
| PGOT Ours | 88.00 ± 2.91 | 82.00 | 8.00 | 4.00 | 5.72 |
82.00% of navigation configurations succeed in all three executions. PGOT also has the lowest collision rate and largest mean minimum building clearance among the evaluated student policies.
10 tasks × 50 initial states · 3 executions each · 520-step horizon
| Policy | SR (%) ↑ | Pass³ (%) ↑ | MES ↓ |
|---|---|---|---|
| Teacher SFT 9B | 49.13 ± 0.61 | 37.20 | 408.02 |
| Student SFT | 45.47 ± 0.95 | 31.40 | 409.95 |
| FKL | 44.93 ± 1.33 | 39.40 | 413.11 |
| RKL | 37.73 ± 0.83 | 22.20 | 433.07 |
| ABKD | 41.93 ± 1.03 | 27.40 | 416.14 |
| ToDi | 43.73 ± 0.81 | 27.40 | 416.21 |
| Shallow-π | 47.07 ± 1.62 | 32.40 | 407.13 |
| VLA-AD | 39.73 ± 0.90 | 25.20 | 424.94 |
| PGOT Ours | 49.47 ± 0.64 | 45.40 | 400.47 |
45.40% three-out-of-three completion on LIBERO-10. PGOT also uses the fewest mean execution steps among the evaluated policies, counting all episodes including failures.
SR: mean success rate ± sample standard deviation across three evaluation rounds. Pass³: fraction of initial configurations completed in all three executions. CR / TR: collision / timeout rate. MMBC: mean minimum building clearance. MES: mean execution steps. Bold marks the best student value. All students use Qwen3.5-0.8B; action sampling temperature is 0.3. Source: paper, Table 1.
Removing any component lowers SR and Pass³ in both domains. Removing Geometry produces the largest decrease in both metrics.
| Objective | UAV SR (%) ↑ | UAV Pass³ (%) ↑ | LIBERO SR (%) ↑ | LIBERO Pass³ (%) ↑ |
|---|---|---|---|---|
| PGOT | 88.00 ± 2.91 | 82.00 | 49.47 ± 0.64 | 45.40 |
| w/o Geometry | 82.22 ± 2.14 | 72.67 | 44.60 ± 0.87 | 29.80 |
| w/o Criticality | 83.78 ± 1.54 | 74.67 | 48.67 ± 0.90 | 42.40 |
| w/o Reliability | 84.89 ± 3.29 | 75.33 | 47.67 ± 1.62 | 34.20 |
Source: paper, Table 2. Removing Geometry sets w₁ = 0; Criticality sets γ = 0; Reliability sets α = βᵣ = 0.
04 / In motion
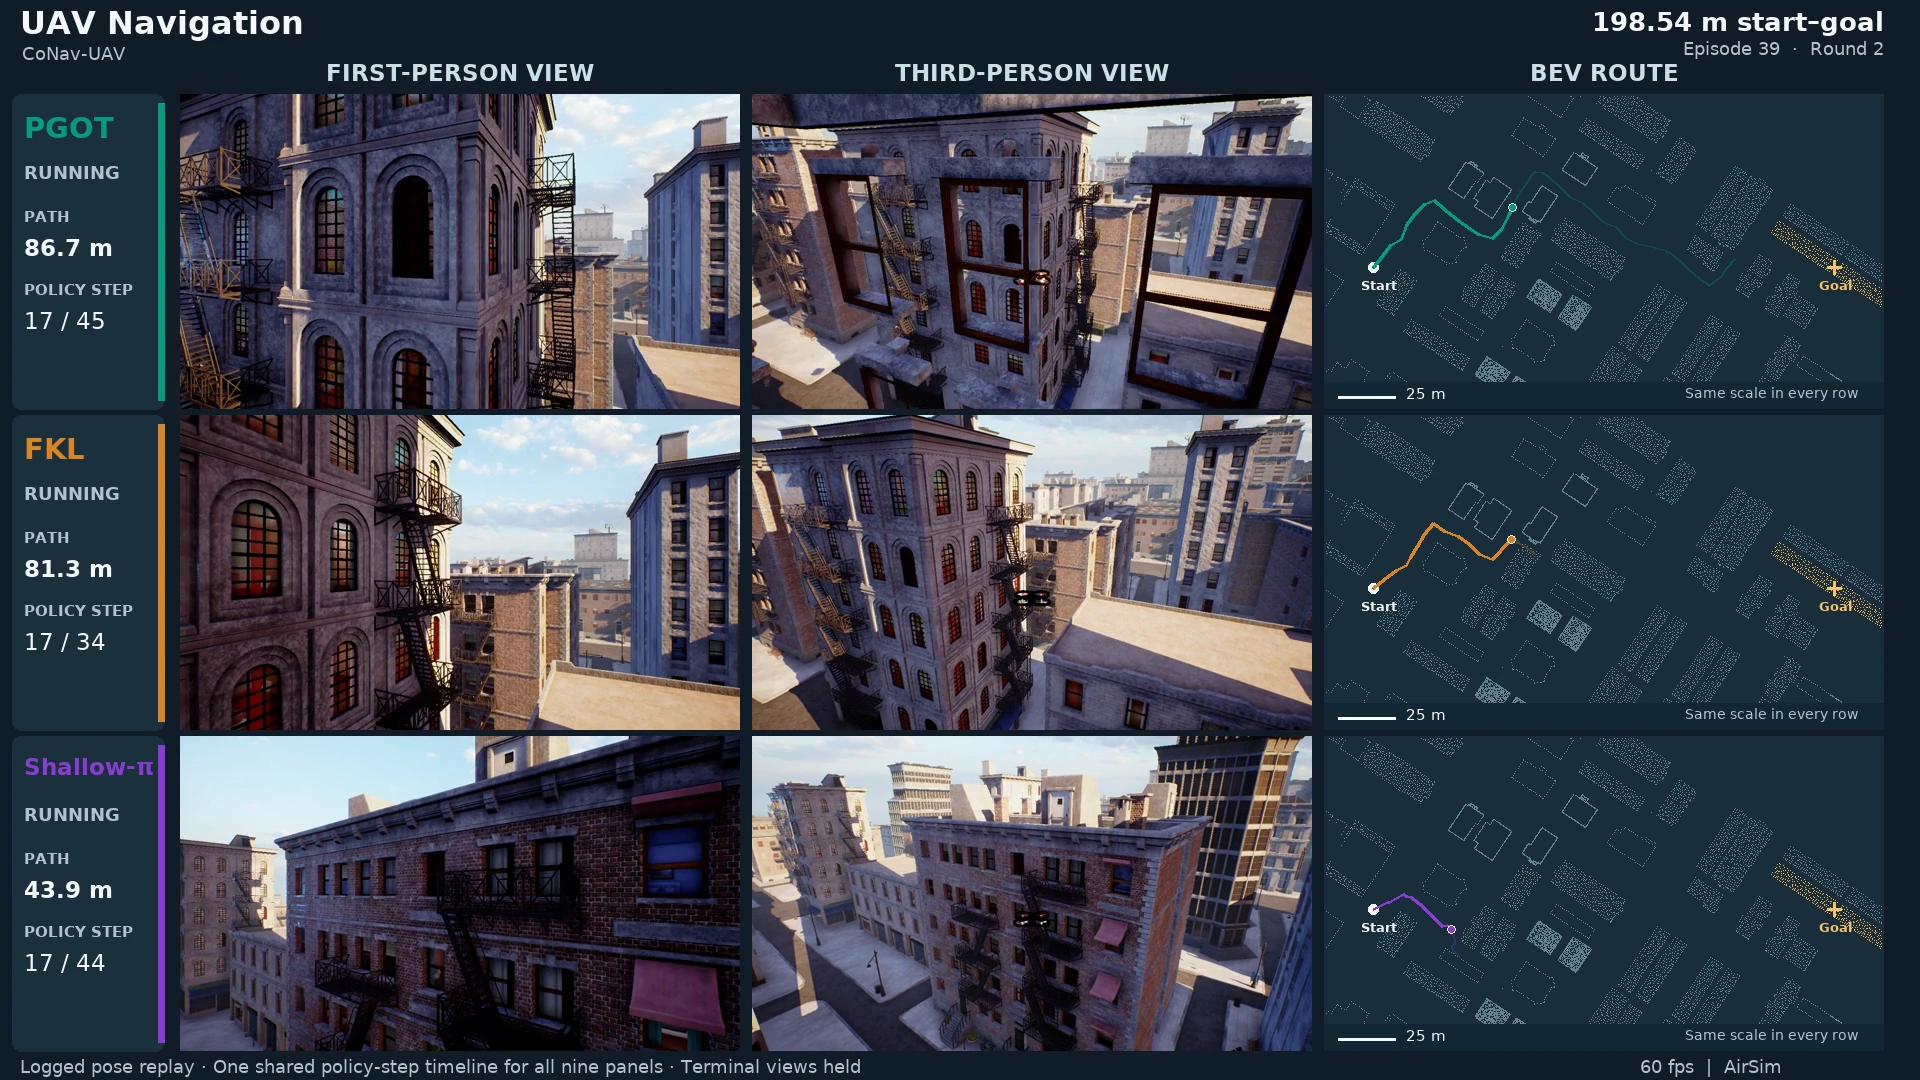
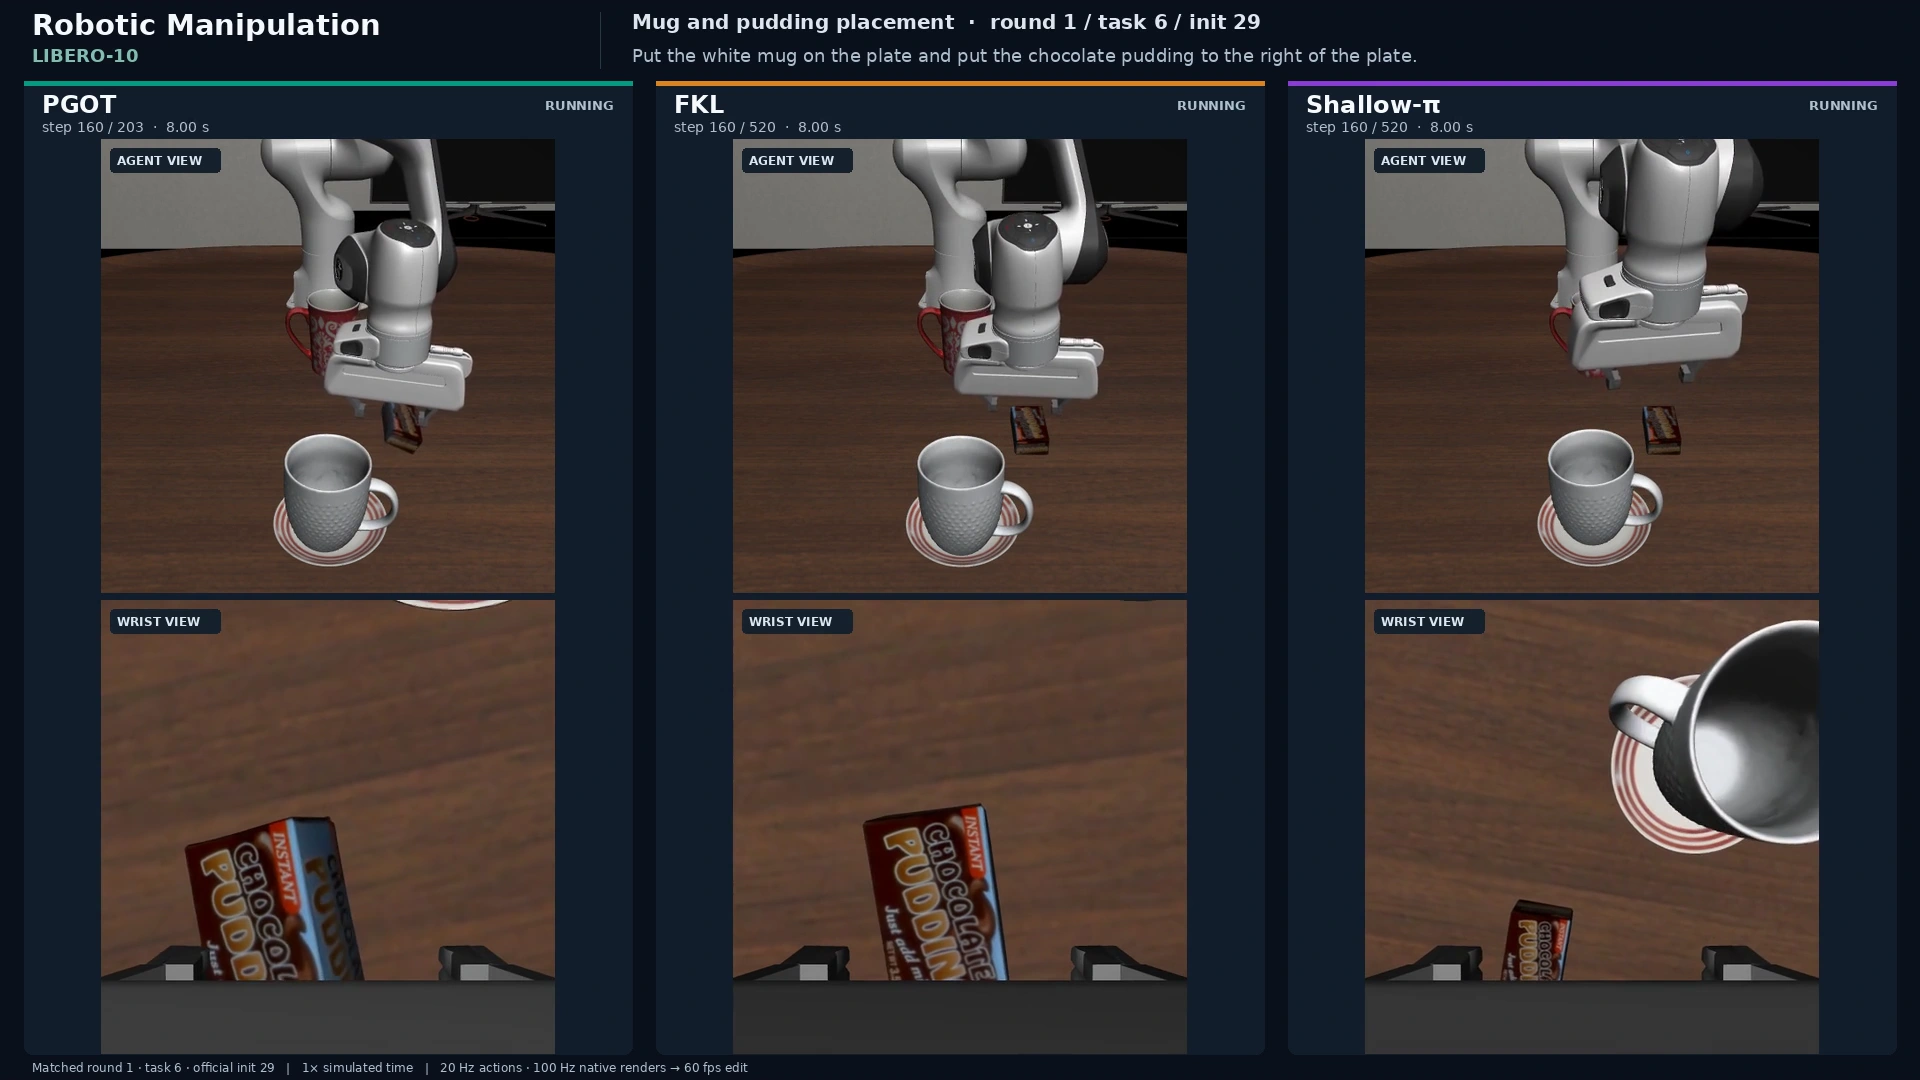
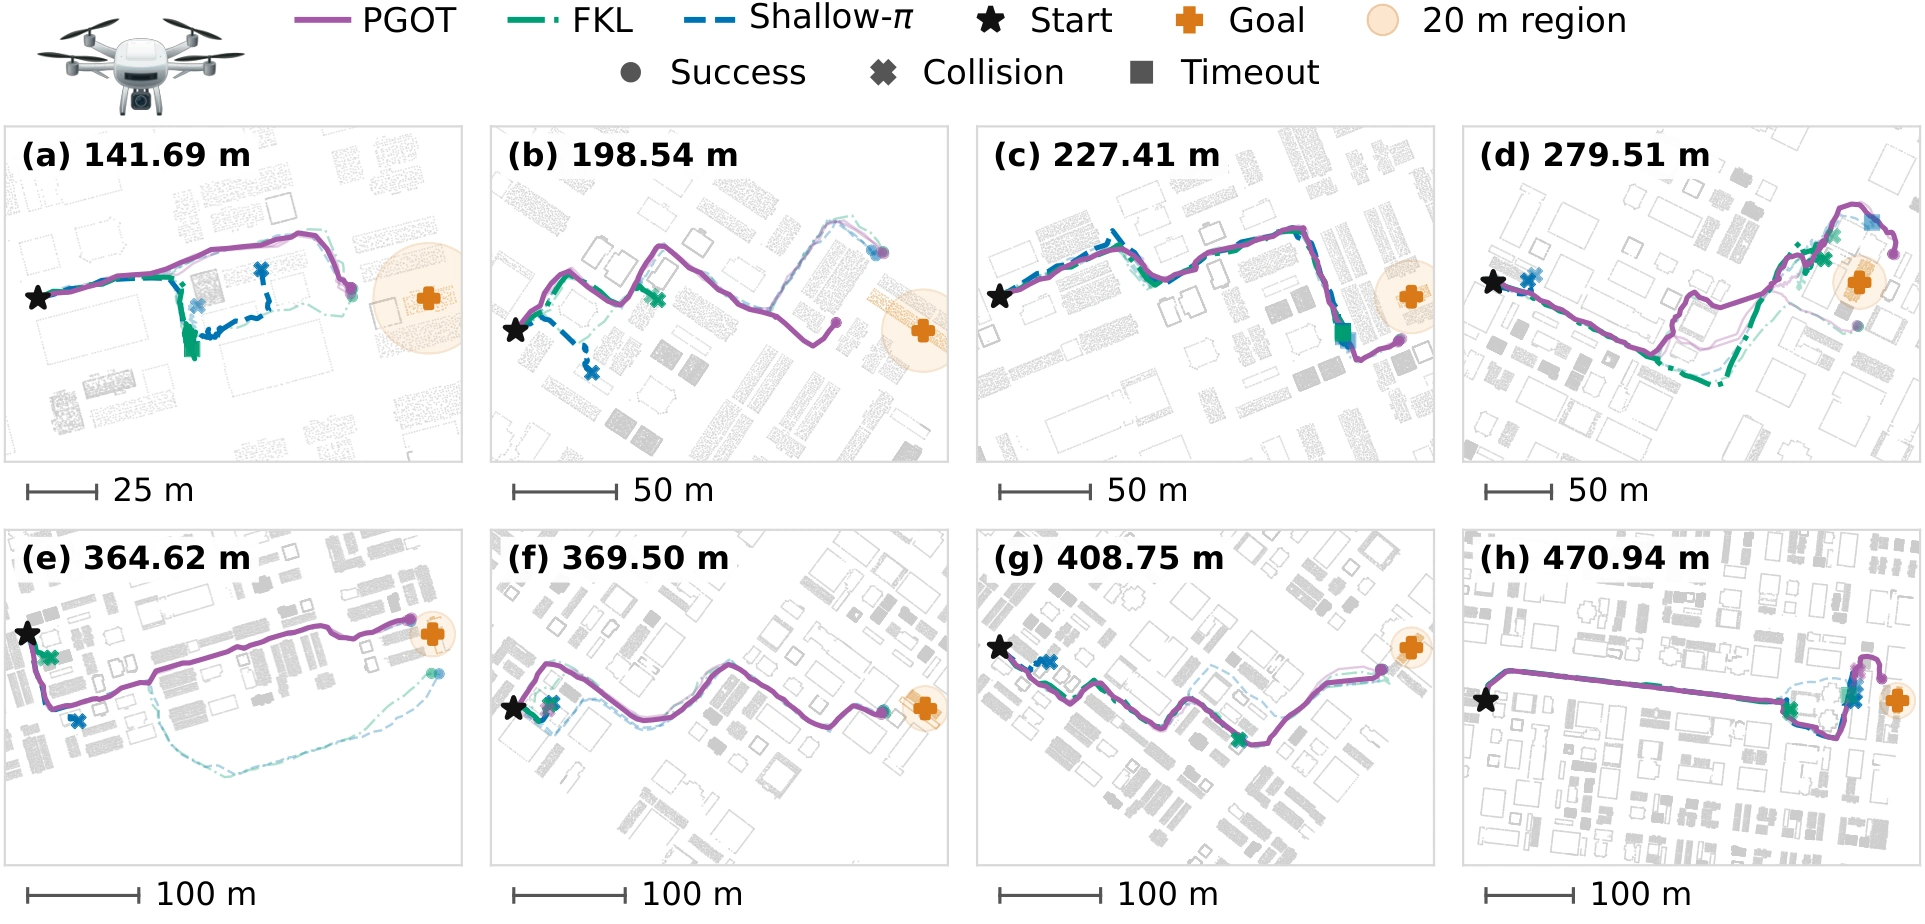
Side-by-side replays compare PGOT, FKL, and Shallow-π on matched initial configurations. These are selected qualitative examples; the tables report the full benchmark evaluation.
Rows: PGOT, FKL, Shallow-π. Columns: first-person, third-person, and bird’s-eye views. In these four selected replays, PGOT succeeds while both baselines collide. Silent video on a shared policy-step timeline, normalized within each case; terminal frames are held.
Download videoColumns: PGOT, FKL, Shallow-π. Rows: agent and wrist camera views. In these three selected replays, PGOT succeeds while both baselines time out. Silent video at 1× simulated time; terminal frames are held.
Download video05 / A closer look
Training and paired-rollout diagnostics connect the components to complementary gradients, control transitions, and fewer corrective actions.
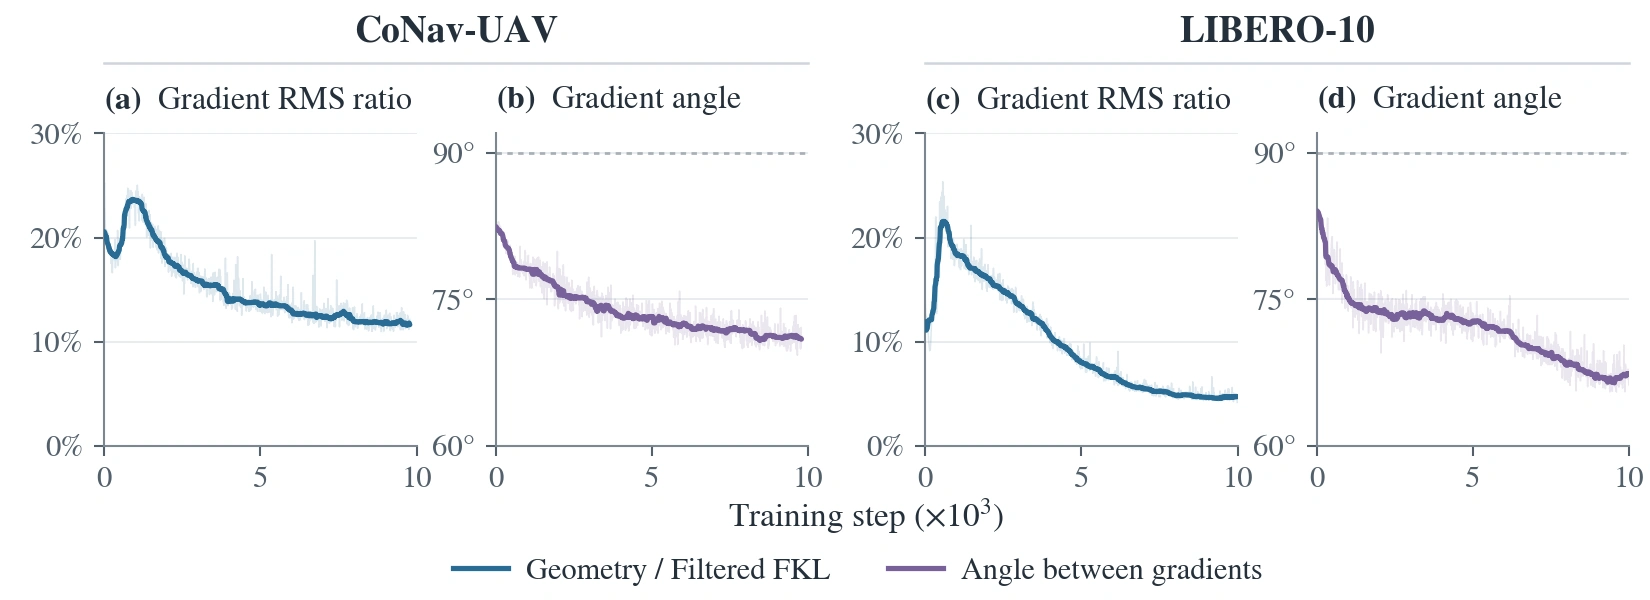
Geometry contributes a distinct gradient direction: mean angles to filtered FKL are 73.94° on CoNav-UAV and 72.05° on LIBERO-10.
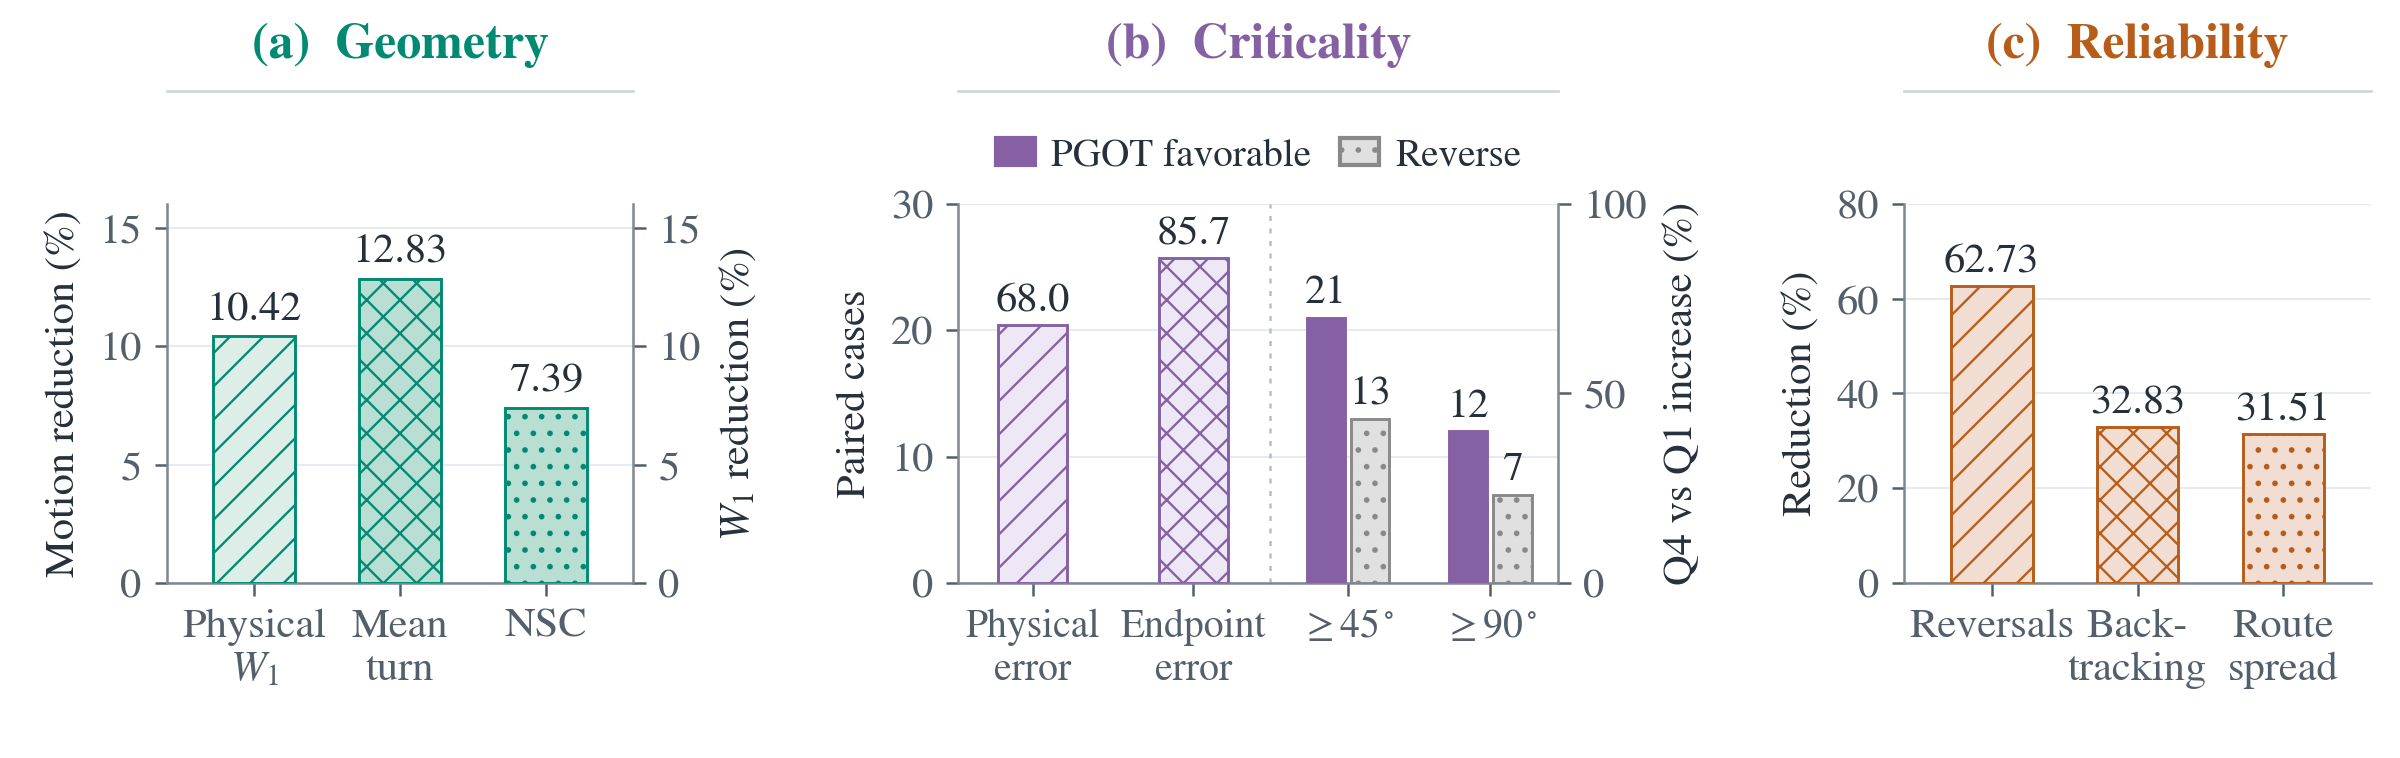
On CoNav-UAV, PGOT reduces validation physical W₁ by 10.42% relative to w/o Geometry. On jointly successful attempts, reversals and backtracking decrease by 62.73% and 32.83% relative to w/o Reliability.
Explore the research
The anonymous repository includes training, data preparation, evaluation, and metrics.